Direct Compression of Co-Processed Mannitol-HPMC for Controlled Release Tablets
Published January 27, 2026
Presented at the Controlled Release Society annual meeting, 14-18 July 2025, Philadelphia, Pennsylvania, USA.
Authors
Lauren Fowler
CTS Scientist, Roquette America
Erik Dixon-Anderson
Head of Analytical RD & CTS, Roquette America
Peter Freed
Global Head of Customer Technical Developement, Roquette America
Introduction
Controlled release formulations are becoming more popular in the market due to their ability to release drug into the system at a determined rate to achieve most effective therapeutic ranges over time. Managing the drug release profile allows formulators to set the dosing to provide a steady and predictable treatment over longer times than immediate release formulations. With these benefits, patients can reduce the number of maintenance dosages per day without losing therapeutic effects. Having controlled release excipients that are direct compressible allows for oral dosage tablets to be easily made without the time needed to process the material before compression.
Methods
Several blends of varying ratios of PEARLITOL® CR-H co-processed mannitol-HPMC, PEARLITOL® 200 GT granulated mannitol, HPMC K100 (Spectrum Chemical), and HPMC K100M (Spectrum Chemical) were evaluated with model drug propranolol HCl. Table 1 outlines the 6 formulations and their corresponding compositions. Excipients and drug were sieved through a number 20 mesh and mixed in a Turbula® mixer (WAB T2F) for 5 minutes. The lubricant, standard grade magnesium stearate, was added to the blender and mixed for an additional 2 minutes. Powder characteristics for each blend were measured: bulk and tap density (Sotax TD1), true density (Micromeritics AccuPyc II 1345), flowability of 100 g through 10 mm orifice (Sotax PF1), and particle size distribution (Malvern Mastersizer 3000). Direct compression was performed with a STYL’One Evo compaction simulator (Korsch) using Euro B 10 mm standard concave tooling with a curvature radius of 10 (Natoli Engineering) and simulating a Korsch XL 400 tablet press with a target tablet weight of 400 mg. A range of compression forces were studied: 5, 10, 15, 20, and 25 kN at a press speed of 25 rpm (52,500 tablets/hour). Ten tablets from each set of parameters were tested for weight, thickness, diameter, and hardness using a Sotax tablet characterizer (ST50). Friability was tested per USP <1216>. Dissolution of 6 tablets for each formulation were tested in a 2-stage 14-hour dissolution where 1.5 mL samples were taken at 1, 2, 3, 4, 6, 10, and 14 hours and filtered with a 0.45 µm PTFE filter to be tested in HPLC for propranolol HCl quantification. Stage 1 contained 500 mL of 0.1 N HCl with pH 1 for 2 hours, stage 2 added 400 mL of PO4 buffer with pH 10.4 for 12 additional hours. Both stages used a paddle apparatus at 75 rpm at 37°C.
Table 1. Formulations
| Blend # | % Propranolol HCl | % PEARLITOL® CR-H | % PEARLITOL® 200 GT | % HPMC K100 | % HPMC K100M | % Magnesium stearate |
| 1 | 10 | 89 | 0 | 0 | 0 | 1 |
| 2 | 10 | 44.5 | 44.5 | 0 | 0 | 1 |
| 3 | 10 | 29.675 | 59.325 | 0 | 0 | 1 |
| 4 | 10 | 44.5 | 0 | 44.5 | 0 | 1 |
| 5 | 10 | 44.5 | 0 | 0 | 44.5 | 1 |
| 6 | 10 | 66.75 | 22.25 | 0 | 0 | 1 |
Results
Table 2 displays the average values of the powder characteristics performed in triplicate for each formulation. Tabletability and compressibility are shown in Figures 1 and 2. The release profiles (Figure 3) show the average of the 6 tablets tested for each formulation at each time point. Increasing amounts of PEARLITOL® 200 GT over PEARLITOL® CR-H had corresponding increases in release in less time.
Table 2. Powder mix characteristics
| Blend # | Bulk Density (g/cm3) | Tap Density (g/cm3) | True Density (g/cm3) | Flowability (seconds) | Particle Size(µm) d10/d50/d90 | Hausner Ratio |
| 1 | 0.341 | 0.428 | 1.3572 | 28.1 | 44.9/131/271 | 1.26 |
| 2 | 0.480 | 0.573 | 1.3875 | 19.8 | 45.5/133/267 | 1.19 |
| 3 | 0.524 | 0.616 | 1.3999 | 18.0 | 44.8/128/243 | 1.18 |
| 4 | 0.363 | 0.510 | 1.3498 | 31.8* | 31.2/107/251 | 1.40 |
| 5 | 0.361 | 0.522 | 1.3451 | 33.4 | 26.0/86.4/219 | 1.45 |
| 6 | 0.402 | 0.475 | 1.3686 | 24.6 | 44.5/140/309 | 1.18 |
*Agitation applied
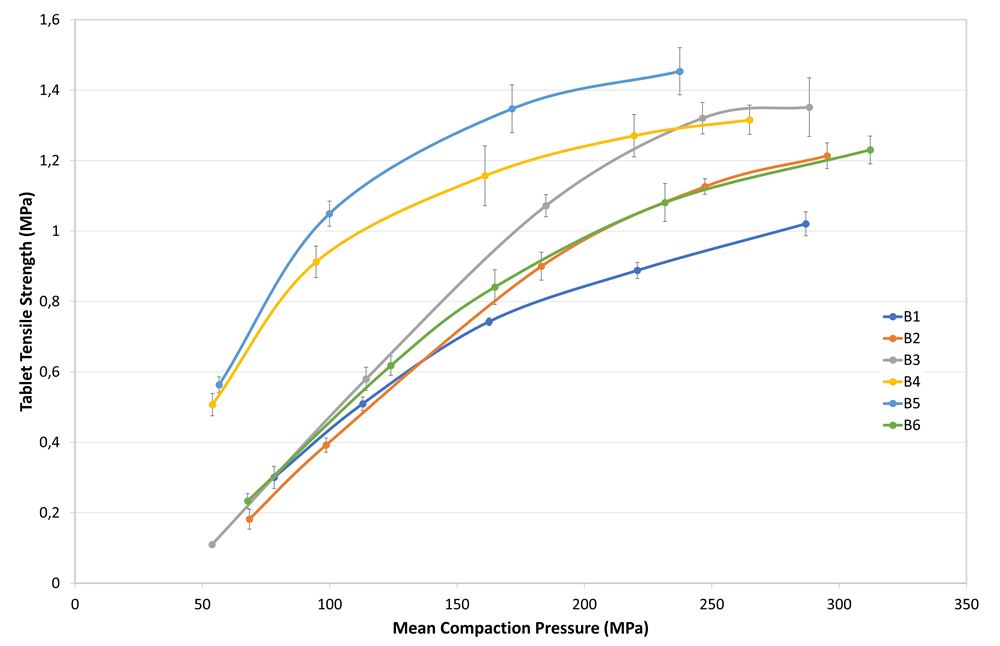
Figure 1. Tabletability profiles of the different powder blends.
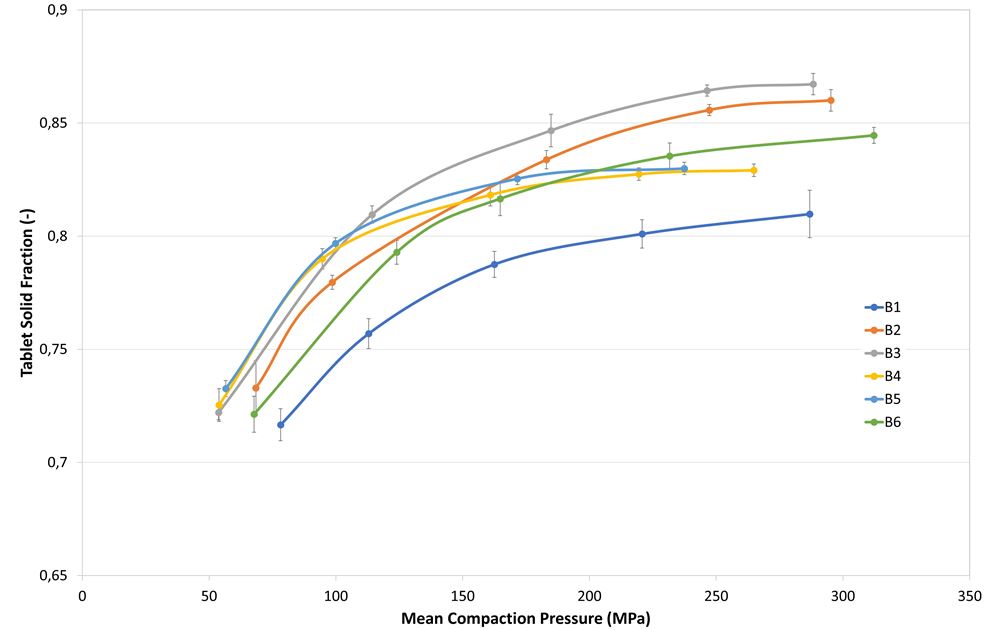
Figure 2. Compressibility profiles of the different powder blends.
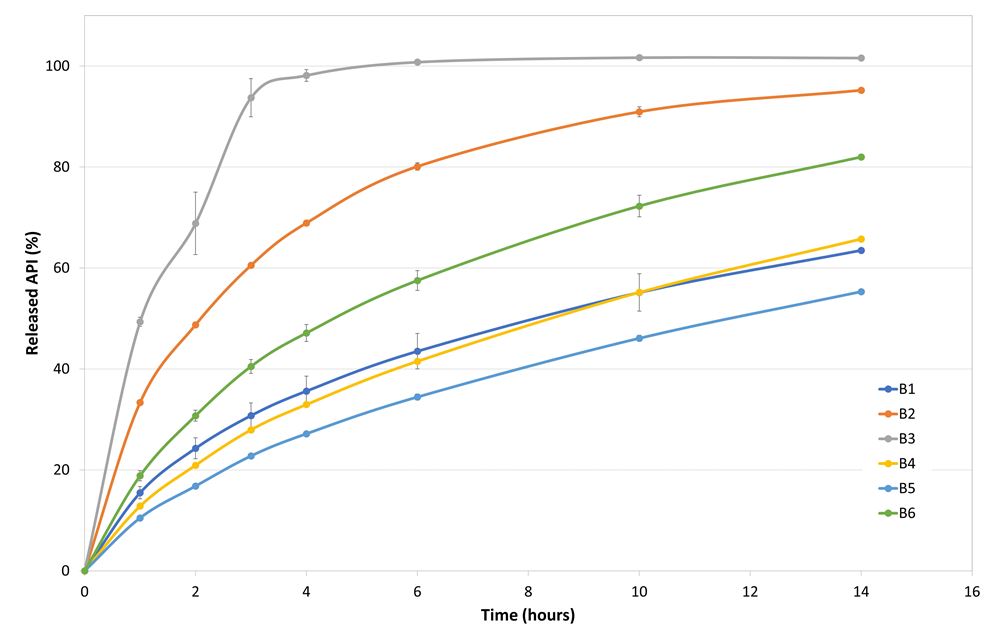
Figure 3. Release profiles of the drug from the different powder blends.
Conclusion
References