Evaluation of a Novel Modified Starch Polymer as a Ready-to-Use Excipient in Oral Disintegrating Film (ODF) for Benzocaine Delivery
Published August 03, 2026
Authors
Dr Carmen Popescu
Global Technical Applications Specialist, Roquette
Michael Moore
Previously Pharma Application Scientist, Roquette
Alain Francois
Previously Application Technician, Pharmaceutical CTS Innovation, Roquette
Bo Zhou
Purdue University, USA
Maria Elisa Luque
Purdue University, USA
Pierre Koch
Purdue University, USA
Delphine Damour
Previously Pharma Application Laboratory Manager, Roquette
Leon Zhou
Head of R&D - Roquette America
Fang Qi
Banner Pharmacaps Inc, USA
Philippe Lefèvre
Head of Global Pharma Applications Labs, Roquette
Rodolfo Pinal
Purdue University, USA
Introduction
In recent years, oral disintegrating film (ODF) became a very popular drug delivery system since it can deliver the drug directly to the systemic circulation (avoiding the first pass metabolism). ODF enhances drug efficacy by lowering the dose and improving the onset of action and consequently patient compliance.
To get the required rheological properties, several hydrosoluble polymers and plasticizers are generally selected. Using only one polymer LYCOAT® RS 720, a non-GMO pregelatinized hydroxypropyl pea starch, we obtained the desired mechanical, rheological, and functional properties.
Using the film casting technique (at room temperature), we obtained an ODF construct having good drug uniformity and dissolution performance.
Materials and Methods
ODF preparation method
The film solution was prepared at room temperature by incorporating the polymer in the aqueous plasticizer solution under continuous mixing. The benzocaine powder was incorporated after adding the surfactant and the emulsifier, followed at the end by the color and flavor. The film formulation was casted using a BYK-Gardner, mechanical drive Resource I equipment. The film was dried at room temperature.
ODF evaluation methods
• Drug content uniformity: ODF strips were dissolved in 100 ml HCl solution pH 1.5 with sonication until completely dissolved and then filtered through a 0.2 μm syringe filter. The drug concentration was evaluated by UV absorption at 226 nm, in triplicate, using a UV-Vis spectrometer Lambda 20, Perkin Elmer.
• Dissolution: Simulated saliva solution consisted of a phosphate buffer saline solution (2.38 g Na2HPO4 and 0.19 g KH2PO4 and 8.00 g NaCl per liter of distilled water adjusted with phosphoric acid to pH 6.75). Dissolution profile of benzocaine ODF was obtained using a DISTEK (Rainbow Dynamic Dissolution Monitor System coupled with Indigo data process software) in 500 ml of simulated salivary fluid dissolution medium (pH 6.8) at 37 ± 0.5 °C with stirring at 100 rpm. Benzocaine ODF was coupled with a pin and the dissolution process was progressed at the bottom site of vessel Absorbance was determined by DISTEK, Rainbow Dynamic dissolution Monitor system, data process software: Indigo. The drug concentration was evaluated by UV absorbance at 282nm, in triplicate, using a UV-Vis spectrometer Lambda 20, Perkin Elmer.
• Rheological properties evaluation: Young modulus, Tensile strength and Elongation at break were evaluated using a Universal Testing Machine (INSTRON 4502), equipped with 2 pneumatic grips. The ODF was placed between the two grips and tensile stress was applied at 50 mm/minute until rupture.
• Powder X-ray diffraction (PXRD) data were collected using an X’Pert Pro MPD system (PANalytical, B.V., Almelo, Netherlands) equipped with a copper anode (Kα = 1.5406 Å), programmable divergence slit and X’CeleratorTM RTMS detector. The operational voltage and amperage were set to 45 kV and 40 mA, respectively. Diffraction data were collected over a 2-60 ° 2θ angular range at a step size of 0.0170 ° and an irradiation time of 31.75 s/step. Analyses were performed using Bragg–Brentano reflectance geometry (equipped with a horizontal spinning sample stage rotating at 16 rpm). The benzocaine powder sample was back-filled into a stainless steel sample holder, while the Benzocaine ODF was placed into a zero-background stainless steel sample holder.
• Dynamic Vapor Sorption: ODF hygroscopicity was evaluated using an automated analysis of gravimetric water sorption technique (DVS1 from Surface Measurement System Ltd, England). The sample was equilibrated at 50% relative humidity (RH) followed by desorption down to 10% RH. Moisture sorption up to 90% RH was then assessed.
• Environmental Scanning Electron Microscopy (ESEM): ODF loaded with benzocaine and placebo were analyzed using an Environmental Scanning Electron Microscope manufactured by FEI, model Quanta 200 FEG (Field Emission Gun) using a 20kV voltage with backscatter detector under low vacuum (30Pa).
• Optical Microscopy: Film images were taken using an Olympus BH2 RFCA.
Results and Discussions
Figure 1 presents an ODF preparation process with LYCOAT® RS 720. The use of LYCOAT® RS 720 as matrix for ODF present many advantages:
• LYCOAT® RS 720 disperses easily in cold water without formation of lumps within minutes,
• LYCOAT® RS 720 is neutral from taste and color point of view,
• LYCOAT® RS 720 is able to form films without using organic solvents,
• Very simple method for ODF preparation and freedom from patent restriction,
• API can be loaded in crystalline form or solubilized in an organic solvent.
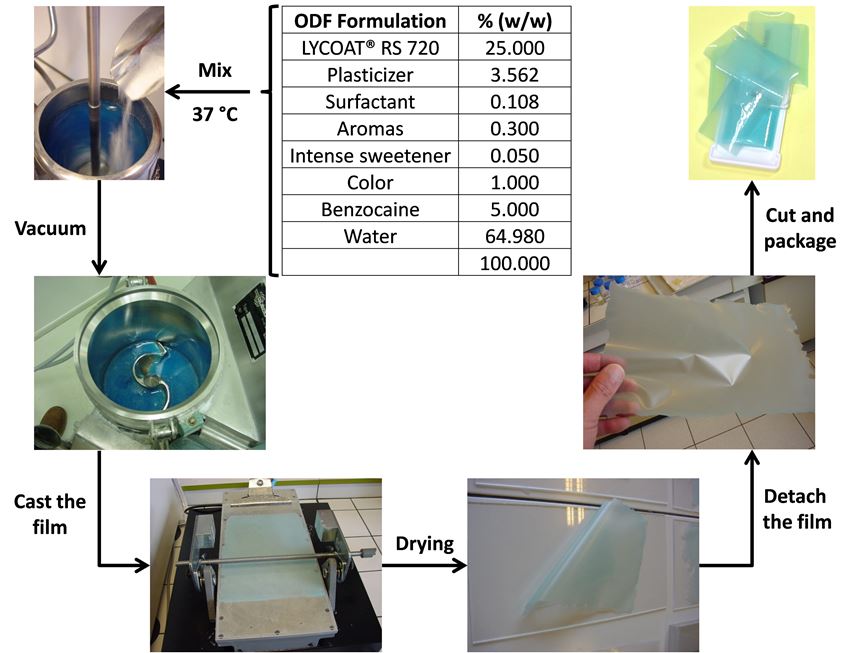
Figure 1. Benzocaine ODF formulation process.
Table 1 presents good benzocaine content uniformity in ODF.
Table 1. Benzocaine ODF content uniformity.
| Sample ID | Benzocaine ODF weight/strip (mg) | Benzocaine weight/strip (mg) | Benzocaine concentration (% w/w) |
| 1 | 74.4 | 9.3 | 12.5 |
| 2 | 74.8 | 9.5 | 12.7 |
| 3 | 93.2 | 12.6 | 13.5 |
Figure 2 shows the quick dissolution of benzocaine from LYCOAT® RS 720 ODF.
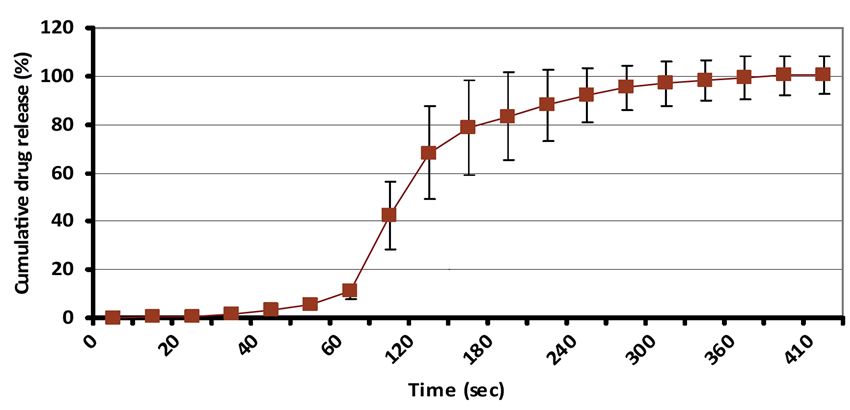
Figure 2. Benzocaine ODF dissolution.
Table 2 presents the mechanical properties evaluated for both placebo and benzocaine ODF. Measured values exhibit appropriate behavior.
Table 2. Benzocaine ODF mechanical properties.
| Thickness (mm) | Tensile strength at break (MPa) | Elongation at break (%) | Young modulus (MPa) | |
| ODF placebo | 0.098 | 12.8 | 2 | 575+/-35 |
| Benzocaine ODF | 0.102 | 6.5 | 2 | 195+/-60 |
Figure 3 shows the powder X-ray diffraction pattern of benzocaine sample. The presence of sharp diffraction peaks confirms its crystallinity. The comparison with the known crystal structure for benzocaine (see inset), indicates phase purity of the sample.
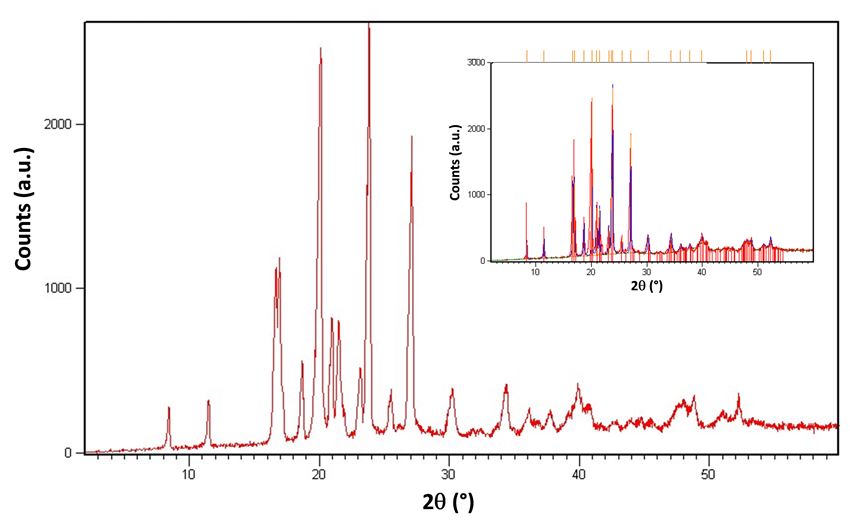
Figure 3. Benzocaine powder X-ray diffraction pattern. Inset: precise alignment of diffraction peaks across 2q range correspond exactly with known crystal structure for benzocaine, indicating phase purity of sample.
Figure 4 presents the X-ray diffraction pattern of benzocaine ODF. Significant diffuse scattering over 2θ range is representative of polymer film matrix; however, the presence of Bragg diffraction peaks confirm crystallinity. In the inset, superimposition of benzocaine PXRD pattern (red) with film pattern (blue) confirms the presence of crystalline API.
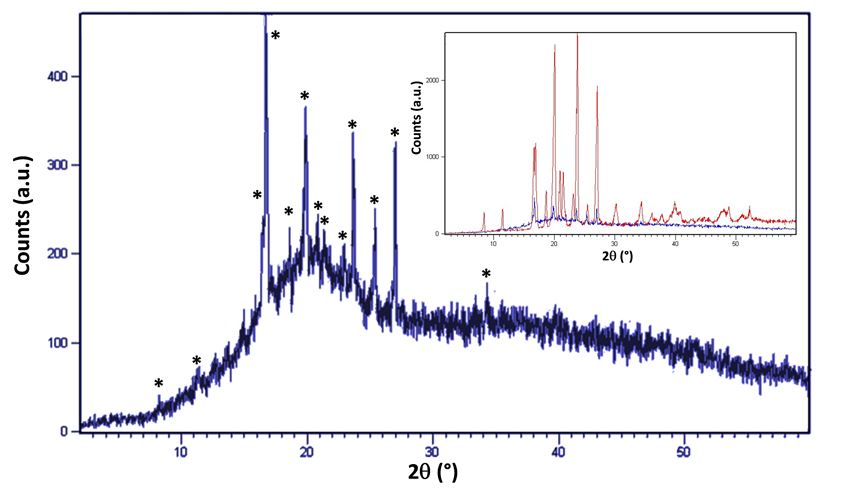
Figure 4. Benzocaine ODF X-ray diffraction pattern. Inset: superimposition of benzocaine PXRD pattern from figure 3 (red) with benzocaine ODF XRD pattern (blue). Asterisks indicate benzocaine diffraction peaks in film pattern.
Water having a plasticizing effect on starch, water uptake and dryness due to air relative humidity variation can have an impact on ODF stickiness or brittleness. Figure 5 shows the mass variation of benzocaine ODF submitted to relative humidity variations. It demonstrates that LYCOAT® RS 720 based ODF formulation exhibits low sensitivity to RH changes, which means that it is not decisive in packaging selection.
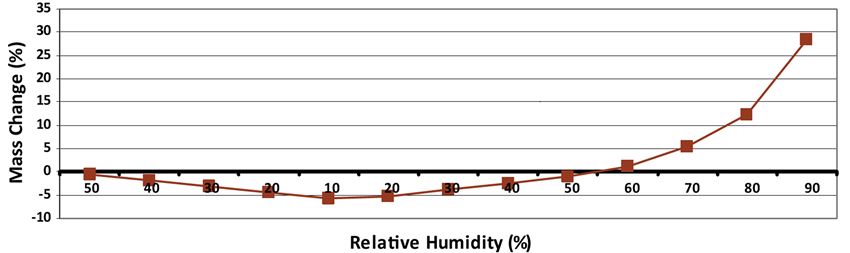
Figure 5. Mass variation of benzocaine ODF submitted to relative humidity variation at 20 °C.
Cross section images of placebo and benzocaine ODF are presented in figure 6. Figure 6-B further shows the crystallinity of benzocaine dispersed in the LYCOAT® RS 720 film.
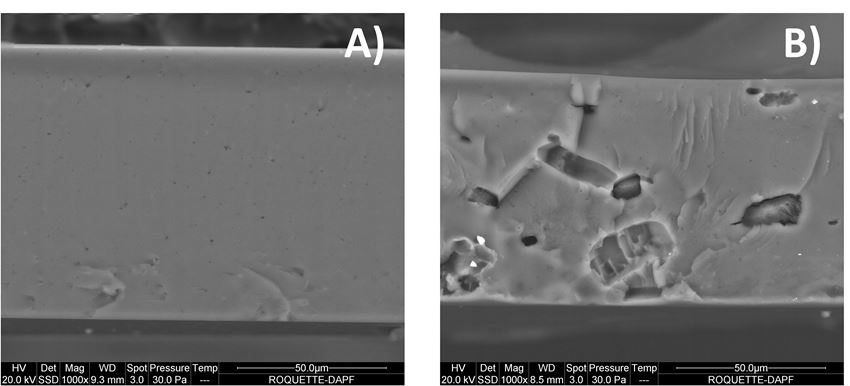
Figure 6. Environmental Scanning Electron Microscopy of ODF cross-section. A) Placebo ODF, B) Benzocaine ODF.
Optical microscopy images of benzocaine ODF (not shown here) were analyzed using Image J software. A uniform particle size distribution of crystalline benzocaine was observed within the film (18 +/- 9 µm).
Conclusion
LYCOAT® RS 720 has unique film forming properties capable of producing an ODF using a sole polymer. It allows incorporation of hydrophilic, hydrophobic and temperature sensitive APIs. This film offers dose homogeneity with fast dissolution.
® Registered trademark(s) of Roquette Frères.
The information contained in this document is to the best of our knowledge true and accurate, but all instructions, recommendations or suggestions are made without any guarantee. Since the conditions of use are beyond our control, we disclaim any liability for loss and/or damage suffered from use of these data or suggestions. Furthermore, no liability is accepted if use of any product in accordance with these data or suggestions infringes any patent. No part of this document may be reproduced by any process without our prior written permission. For questions about a product’s compliance with additional countries’ standards not listed above, please contact your local Roquette representative.